
Crypto Snapshot: October 2020 in Numbers
Software Focus recaps the most interesting and thought-provoking events on the global crypto scene in October 2020.
Key Highlights
- Bitcoin closed its best month since the beginning of 2018, refreshing its two-year price high at $14,100;
- The activity on the regulated CME platform and the influx of funds into Grayscale indicate an institutional interest in the first cryptocurrency;
- DeFi token quotes have dropped significantly.
- The capitalization of Bitcoins tokenized on the Ethereum blockchain is growing rapidly;
- Trading volume on decentralized exchanges has declined, but the overall picture speaks to the popularity of DEX among users;
- Market growth has sparked a surge in transactions in the USDT stablecoin;
- USDT capitalization approached $3 billion;
- More central banks have announced their intention to study and develop a digital currency (CBDC);
- Jack Dorsey’s Square invested 1% of its savings in Bitcoin;
- PayPal added support for cryptocurrencies.
BTC and ETH Prices
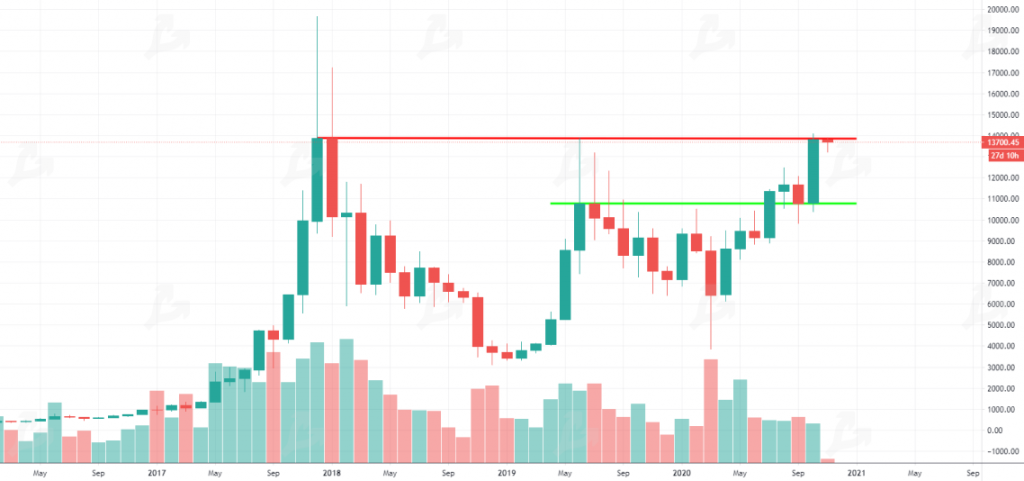
- In October, Bitcoin price rose 28%;
- The first cryptocurrency updated its annual maximum, and then a two-year maximum, closing the best month since 2017-2018;
- The price has remained above $10,000 for over three months (96 days as of November 1st);
- Since the third halving, BTC has grown by 60%;
- New money is entering the market, as evidenced by the record number of Bitcoin addresses and the growth in market capitalization above $400 billion for the first time since 2018;
- Fundamental factors point to further gains, but trading volume in October was relatively small.
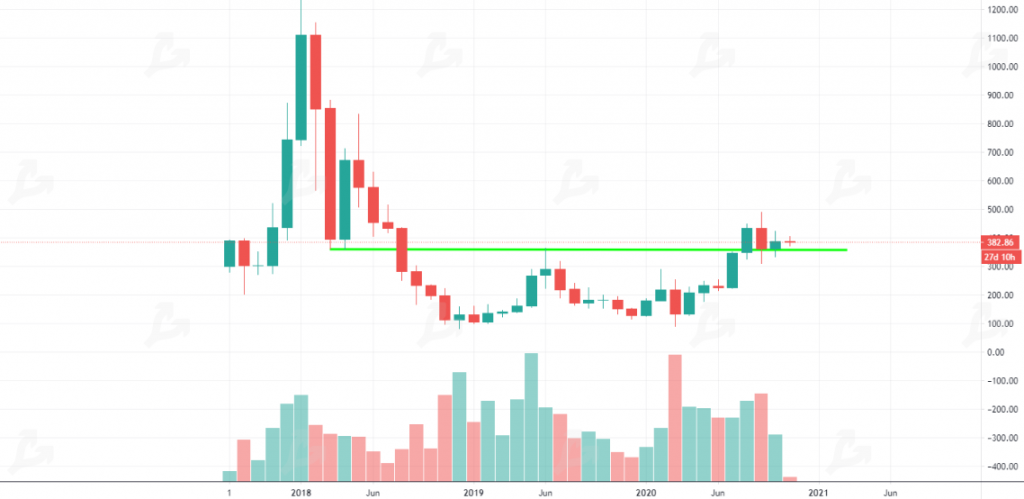
- Ethereum held the $350 level, but the price did not get close to the annual maximum;
- Fundamentally, the picture looks optimistic for continued growth – the hash rate, the value of assets blocked in the DeFi sector (TLV), and the number of addresses with 32 ETH or more are growing.
Market performance and correlations
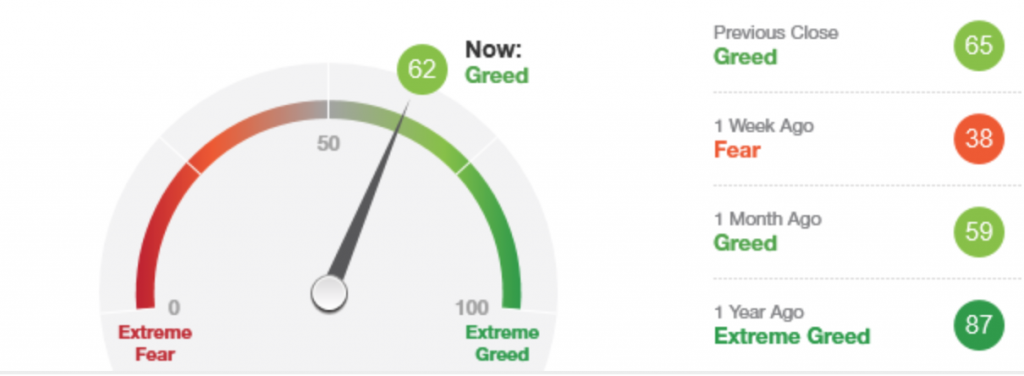
The cryptocurrency Fear and Greed Index was growing steadily, indicating optimism in the market and increased volatility. The average indicator for October was 57.1 (in September it was 46.9).
The renewed interest in Bitcoin is also evidenced by the dynamics of Google search queries. The indicator grew steadily throughout October, almost reaching its peak summer levels.
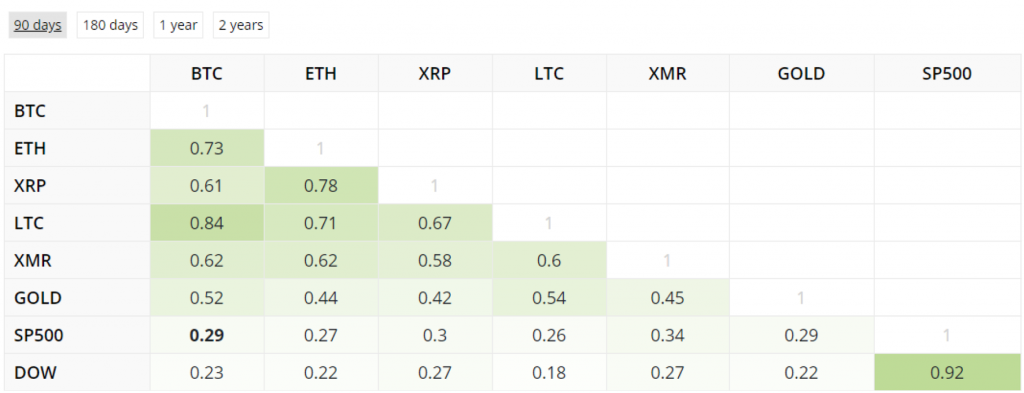
Bitcoin’s correlation with other cryptocurrencies is consistently high. The asset also has a consistently close statistical relationship with gold – 0.52 (90-day reading as of November 1st).
The correlation of the first cryptocurrency with the S&P 500 index dropped significantly over the month. On November 1, the indicator is at around 0.29, although on October 1, it was 0.41. Such a “decoupling” from the stock market, while closely correlating with gold, may indicate the restoration of the “safe haven” status of bitcoin.
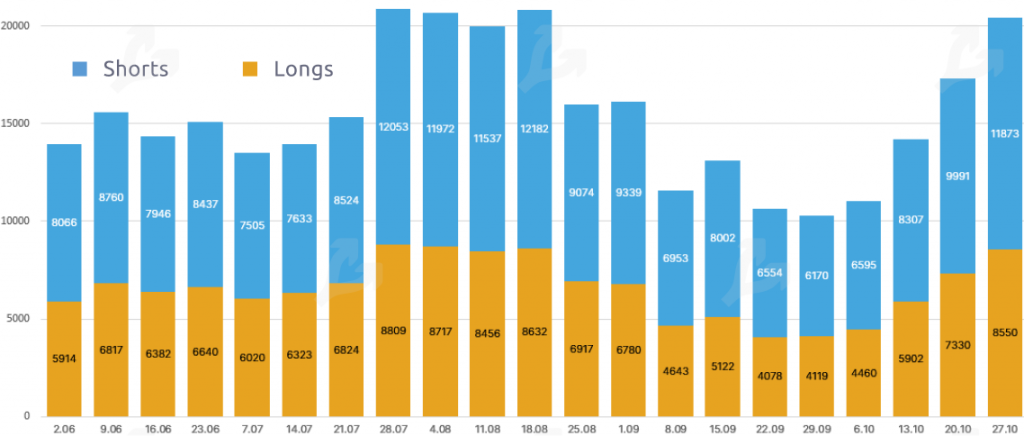
Trade volume
Despite the rise in Bitcoin, trading volume on cryptocurrency exchanges fell 42% in October. The aggregated value for the leading platforms was $90.4 billion, up from $156 billion in September.
The rise in Bitcoin and Ethereum was accompanied by activity in the derivatives market – the trading volume in futures increased significantly in the second half of October.
The volume of open positions again exceeded the $5 billion mark. The rapid growth of volumes was also recorded in the options market. On October 30, more than 60 thousand Bitcoin and Ethereum contracts traditionally expired, as a result of which the volume updated the record at levels above $600 million.
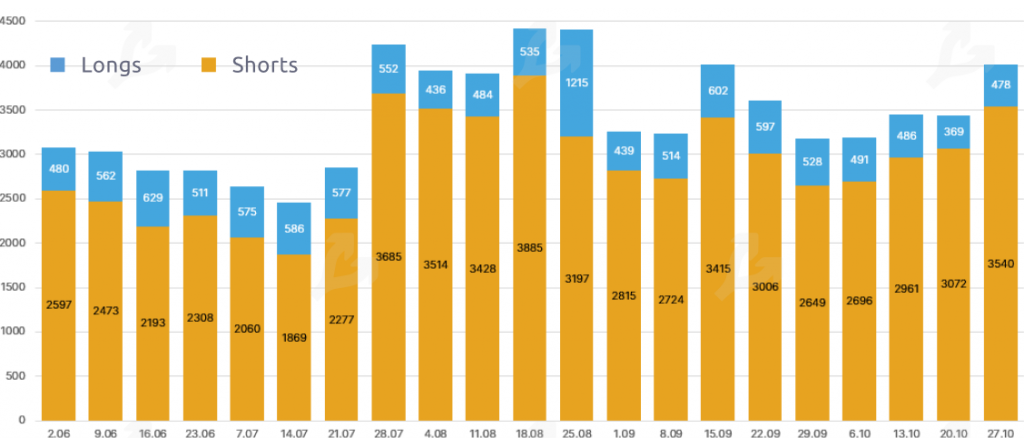
Activity on regulated platforms
During October, the amount of open positions in Bitcoin futures on the Chicago Mercantile Exchange (CME) increased by more than 70%. The revival of activity among institutional players in the Commercial category is especially noticeable. The latter closed all short positions by the end of October, focusing on longs. The share of institutions in open interest is still relatively small – 2.1%, but the indicator is increasing (at the end of September it was about 1%). And if before there was only one Commercial representative, now there are three of them.
The price of Bitcoin was closely correlated with the increase in open interest in Bitcoin futures. The share of CME in the total indicator at some point outstripped the popular unregulated platforms Binance, BitMEX, and Huobi, losing only to OKEx.
Short positions continue to dominate among hedge funds and other major players. The overwhelming majority of small market participants remain on the side of the bulls.
DeFi
DeFi tokens continued their correction in October. According to Messari, the Uniswap (UNI) token dropped 41.44% over the month, SushiSwap (SUSHI) – 46.38%, Curve (CRV) – 47.66%, Balancer (BAL) – 38.35% …
On October 30, the price of yEarn Finance (YFI) dropped below $ 10,000, although in September the token reached $ 43,000. On October 25, a record amount of blocked funds ($ 12.46 billion) was recorded in the DeFi segment.
The capitalization of Bitcoins tokenized on the Ethereum blockchain is growing rapidly. In two months, their number increased from 50,000 to 150,000. The Wrapped Bitcoin (WBTC) protocol is the leader in terms of the number of blocked funds. It took third place in the overall ranking of DeFi projects with an indicator of $1.6 billion (117,585 BTC). 22499 BTC are blocked in renBTC, 6010 BTC in HuobiBTC.
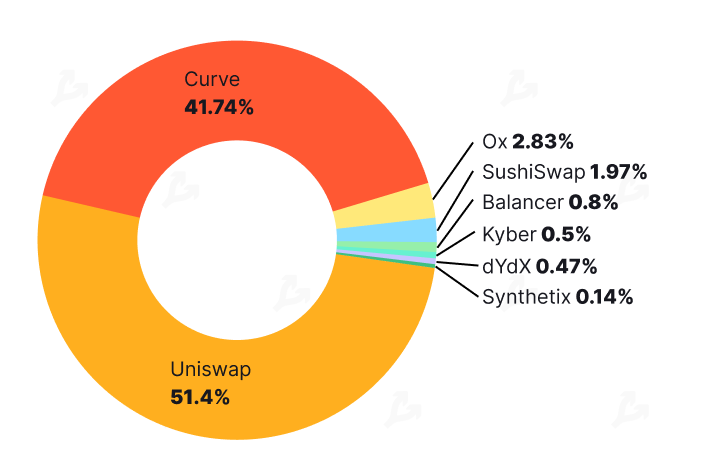
DEX
Trading volume on decentralized exchanges (DEX) in October reached $19.35 billion, which is $6.9 billion less than in September (-26%).
The Uniswap exchange remains the leader in the segment, accounting for 51.4% of trading ($11.2 billion). Due to tougher competition, the leader’s market share decreased by 16.3% over the month. During October, the share of Curve increased significantly – from 18.6% to 41.74%. T
he share of SushiSwap dropped significantly – from $ 2.2 billion to $ 891 million. Volume on Balancer also decreased from $ 1.13 billion in September to $ 348 million in October. Users actively use the 0x protocol – the trading turnover on the platform is growing by $ 400 million for the third month in a row, in October it reached $ 1.2 billion.
Stay tuned with Software Focus!